
As an avid learner, I have a passion for acquiring knowledge and constantly improving my skills. If you’ve followed my previous posts, you’d know that I love learning about anything and everything. The thrill of comprehending new concepts brings me immense joy and allows me to better understand the world we live in.
I‘ve always tried to decipher available data to figure out why things happened the way they did, make better personal and professional decisions and forecast future events. However, I soon realized that I only „consumed“ data processed by others. If I wanted to reach my own conclusions, without being influenced by any third-party interest, I‘d need to learn how to work with reliable raw data and extract patterns and insights on my own.
Thus, after completing my professional certification in UX design, I decided to explore the exciting realm of data. As a proud member of The Female Factor, a global community for aspiring female leaders, I was thrilled to learn about the organization’s renewed collaboration with Google to offer several professional certificates aimed at enhancing skills in various areas. One of these was in data analytics, and I jumped at the opportunity to embark on this exciting journey into the world of data.
The Google Data Analytics Professional Certificate consists of 8 courses. The first two courses, which I have already completed, introduce you to basic data concepts such as data life cycle and data analytics process, as well as key analytical skills (data cleaning, data analysis, data visualization) and tools (spreadsheets, SQL, R programming, Tableau). In the second course, you can also learn how to ask effective questions to understand which data should be analyzed to provide appropriate answers and how to connect with stakeholders‘ needs, which is crucial for my current role as a product manager.
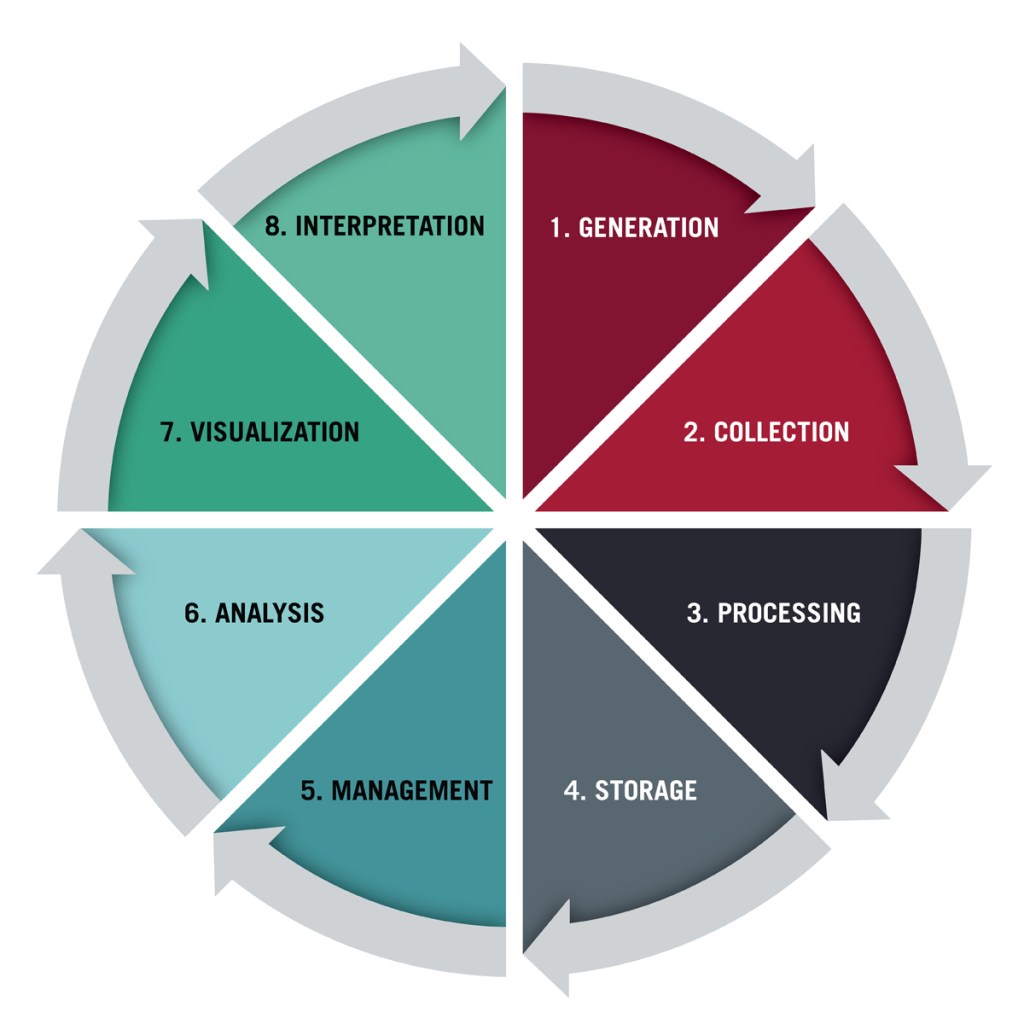
Data lifecycle stages. Source: https://online.hbs.edu/blog/post/data-life-cycle
I don‘t want to bother you with a summary of the things I’ve learned so far. Instead, I‘ve gathered here some curious facts about data that you may find interesting:
Data Generation
We‘re constantly generating data, most times without being aware of it. Predictions estimate the world will generate 181 zettabytes of data by 2025. If you‘re like me and have no clue about what a zettabyte is, here is the answer: A zettabyte is 8,000,000,000,000,000,000,000 bits (a bit is either a 0 or 1 digit).
| Unit | Abbreviation | Approximate size |
| bit | b | binary digit, a single 0 or 1 |
| byte | B | 8 bits |
| kilobyte | KB | 1,024 bytes or 10^3 bytes |
| megabyte | MB | 1,024 KB or 10^6 bytes |
| gigabyte | GB | 1,024 MB or 10^9 bytes |
| terabyte | TB | 1,024 GB or 10^12 bytes |
| petabyte | PB | 1,024 TB or 10^15 bytes |
| exabyte | EB | 1,024 PB or 10^18 bytes |
| zettabyte | ZB | 1,024 EB or 10^21 bytes |
| yottabyte | YB | 1,024 ZB or 10^24 bytes |
To give you a better idea of what a zettabyte can store, here are some fascinating numbers:
- One zettabyte can store the content of 17200000000 64GB iPhones
- An HD movie (1080p) of 1ZB could last 36 million years. To record the whole history of Earth in real time, from the Big Bang to this day, „only“ 125ZB would be needed.
Data Collection
There are seven main methods for collecting data:
- Surveys
- Transactional Tracking -> I had to google this because it was not clear to me:
- Transactional data is the data that describes business events. There is a large volume of transactional data in a business organization. Some common events that create transactional data are buying products from suppliers, selling products to customers, delivering items to customer sites, hiring employees, etc. Therefore, transactional data is generated regularly. Moreover, this data is commonly used in operational applications such as ERP systems, SCM, HR systems, etc. (Source: https://pediaa.com/what-is-the-difference-between-transactional-data-and-operational-data/)
- Interviews and Focus Groups
- Observation
- Online Tracking
- Forms
- Social Media Monitoring
Google and Facebook are the two main data trackers. A study by WhoTracks.Me found that around 82 percent of web traffic contains third-party scripts by Google, and almost half of them are tracking you as a user. That’s around 40 percent of web traffic being tracked by Google alone. Facebook tracks around 15% of the web traffic. Tracking is mainly used for targeted ads.
Data Processing
The first electronic computer, ENIAC, was used for data processing in 1945 and could process 5000 calculations per second. Today, computers can perform billions of calculations per second.
Data Storage
Credits to ChatGPT for the list 😆 See answers to my endless questions inline:
- The first known form of data storage was punched cards, which were first used in the late 1700s to control textile looms
- They looked like this:

- They looked like this:
- The first hard disk drive was introduced in 1956, and it had a capacity of just 5 MB.
- 5MB does not say much to me…What kind of data can actually fit into 5 MB? Not much: a bunch of spreadsheets, a low resolution video clip or a basic website or HTML document
- In 2013, the first terabyte-sized solid-state drive (SSD) was introduced, which was a significant improvement over traditional hard disk drives in terms of speed and reliability.
- It sounds big…but it‘s actually this small:
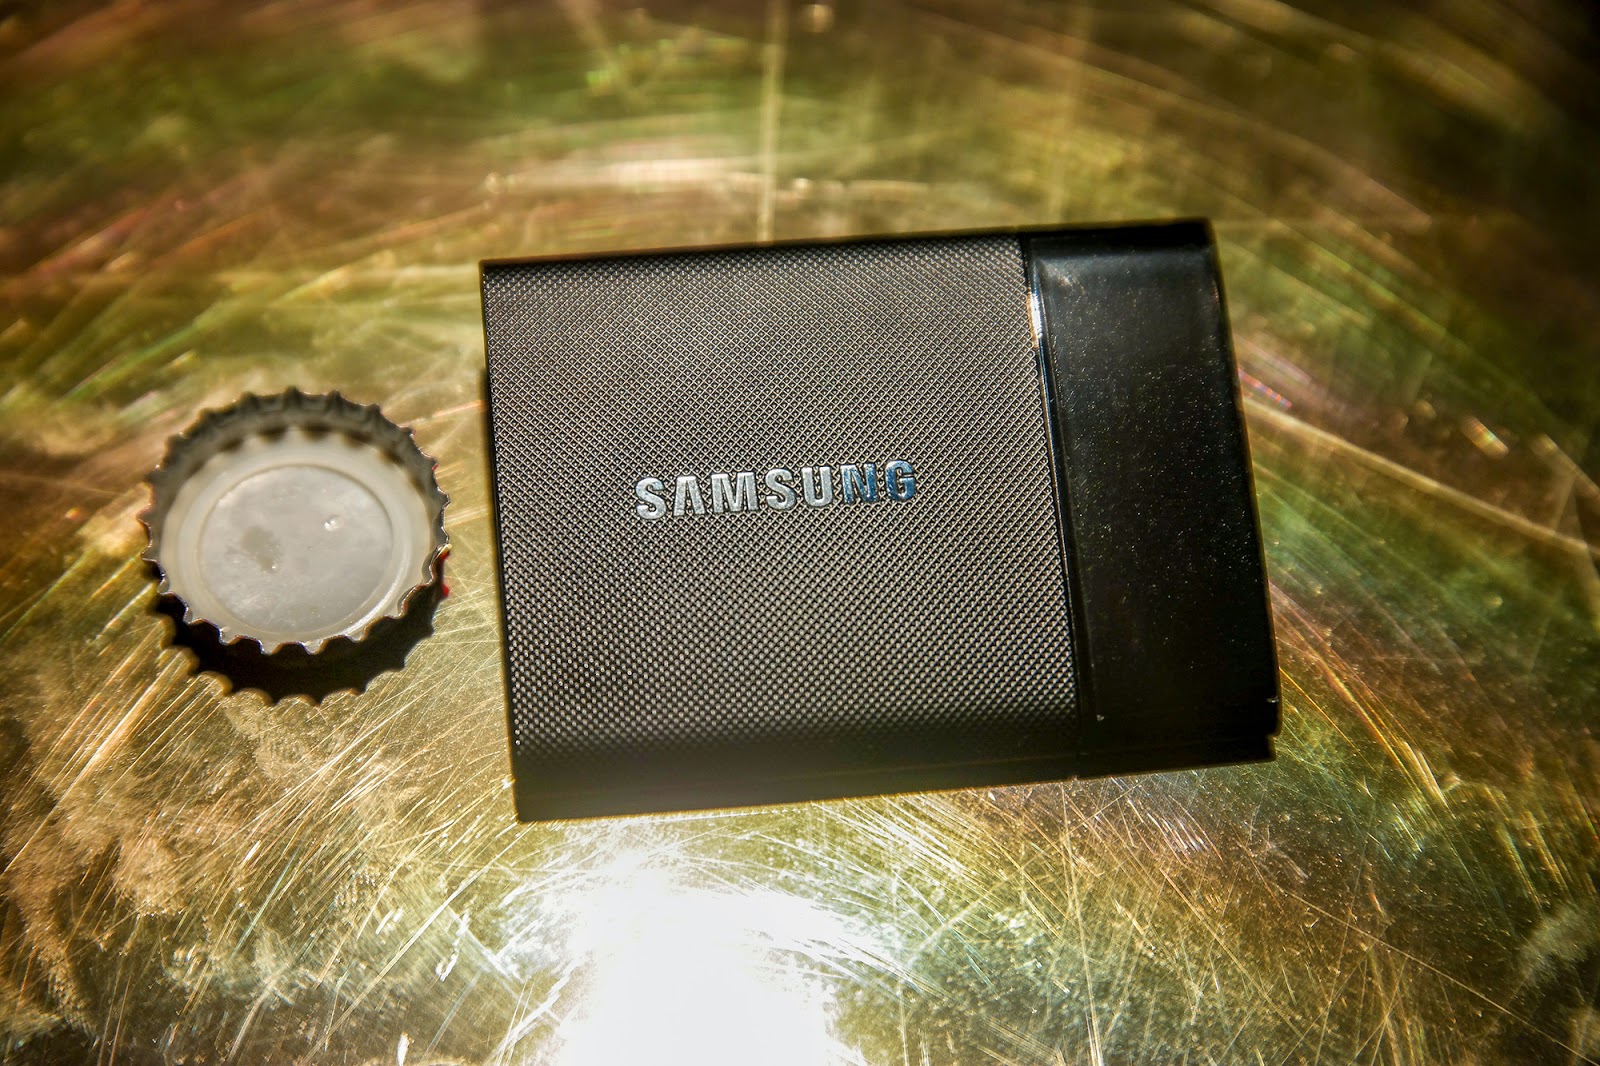
- It sounds big…but it‘s actually this small:
- Cloud storage has become increasingly popular in recent years, with major companies such as Amazon, Google, and Microsoft offering cloud storage services to individuals and businesses.
 For Amazon, for example, this makes up to 12% of their annual revenue…
- In addition to traditional data storage devices such as hard drives and solid-state drives, there are also emerging technologies such as DNA data storage and quantum data storage, which have the potential to greatly increase the amount of data that can be stored in a small space.
- What is DNA data storage? This article explains it very clearly and will blow your mind:

- What is DNA data storage? This article explains it very clearly and will blow your mind:
Other sources:
- https://computerhoy.com/noticias/internet/que-demonios-es-zettabyte-que-tienes-que-saberlo-63492
- https://www.cloudwards.net/data-privacy-statistics/
- https://www.nature.com/articles/537022a
- https://www.scienceandindustrymuseum.org.uk/sites/default/files/styles/embedded_image/public/2019-06/Jacquard-cards-2.jpg?itok=VEt8vlUj


